
James-at-Alembic
Reddit · Product UI Demo
Ad copy
CMOs secret AI weapon for marketing analytics
Call to action: Learn More
Creative notes
Why it fits
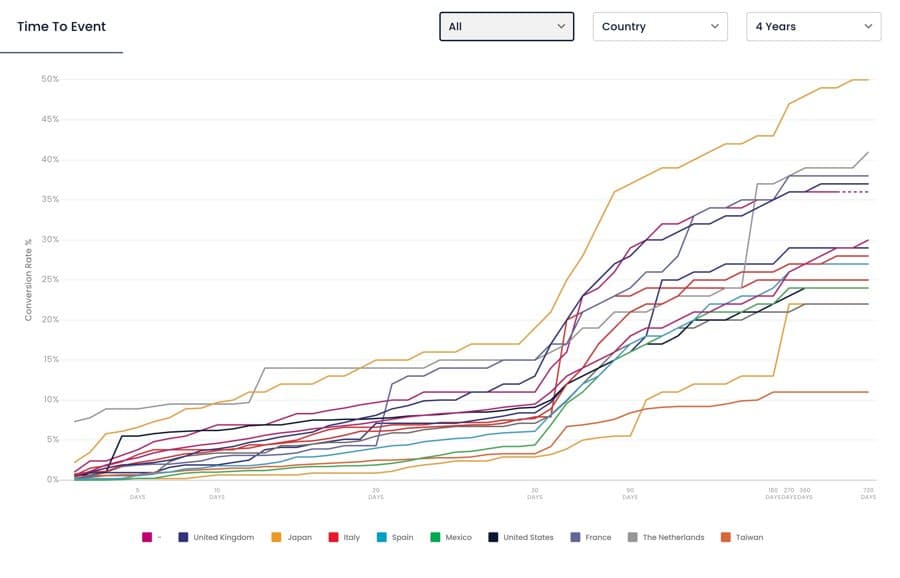
This ad uses a detailed line graph to visually represent conversion rates over time across multiple countries, making it a strong reference for data-driven marketing visuals. The inclusion of dropdown filters for 'All', 'Country', and '4 Years' demonstrates interactive data segmentation in a clean, professional layout.
Copy structure
Headline/Title → Dropdown Filters → Line Graph with Legend → Axis Labels
Elements to replace
Headline/Title; Dropdown Filter 1; Dropdown Filter 2; Dropdown Filter 3; Line Graph; Legend; Axis Labels
Adaptation guidance
Rebuild this mechanism by creating a multi-line chart with distinct color-coded lines representing different categories or countries. Use dropdown menus to allow users to filter data by various parameters such as time range and location, ensuring clarity and interactivity.
Reddit details
Post scores measure net votes. Post creation dates and engagement do not establish ad delivery or paid results.
Ad details
Original creative belongs to James-at-Alembic. Recreate the idea with your own copy and imagery.